Not enough: vote
Polls are not enough. Vote.
But show these polls to the apathetic. There is a good chance to win this, don’t give up. Show up.
As usual, national polls, yadda yadda.
Let’s see the state breakdown now:
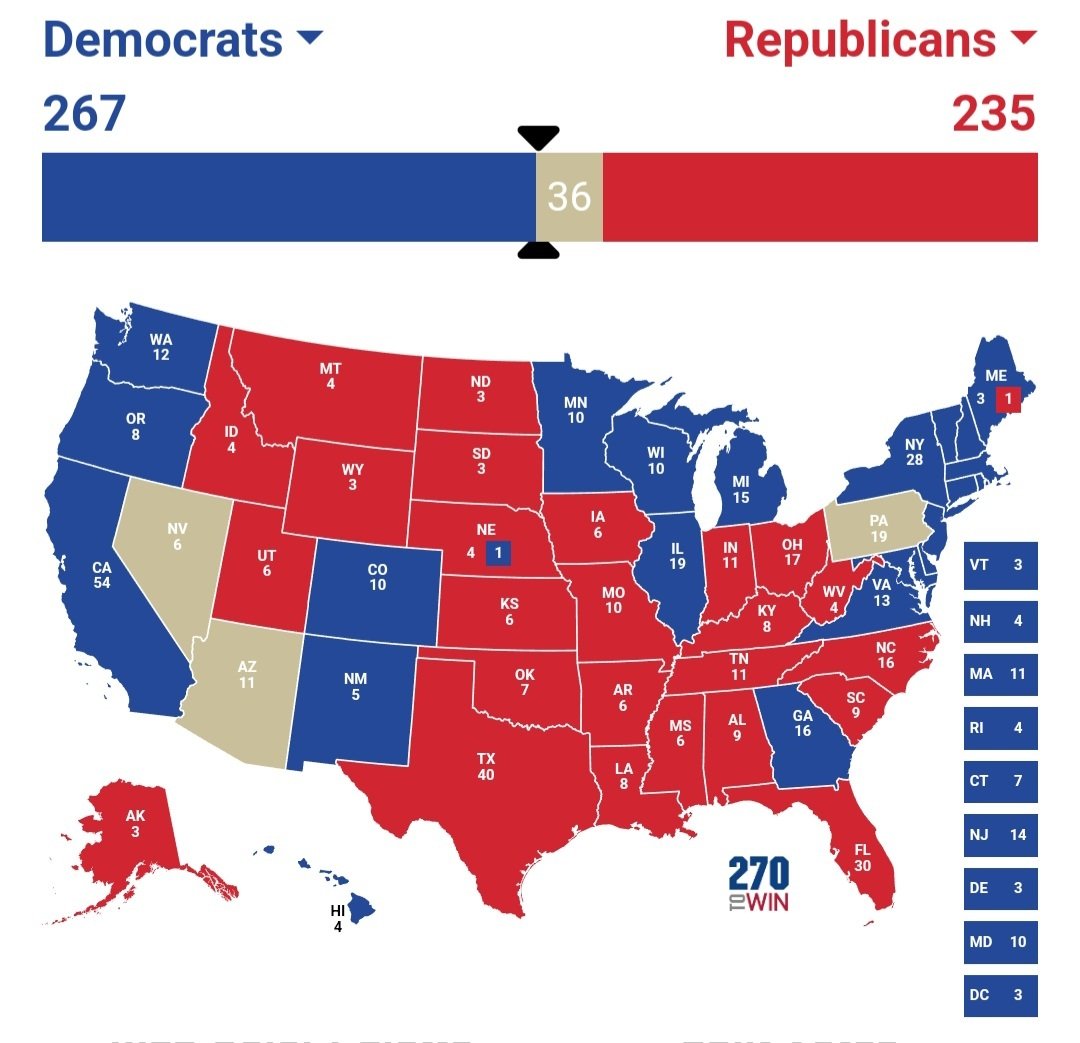
Arizona: Toss Up. Harris +1, Trump +3
https://projects.fivethirtyeight.com/polls/president-general/2024/arizona/Nevada: Toss Up. Harris +2, Tie
https://projects.fivethirtyeight.com/polls/president-general/2024/nevada/New Mexico: Harris +8/+11
https://projects.fivethirtyeight.com/polls/new-mexico/Texas: Trump +3/+5
https://projects.fivethirtyeight.com/polls/texas/Georgia: Harris +1/+2
https://projects.fivethirtyeight.com/polls/president-general/2024/georgia/Florida: Trump +3/+4
https://projects.fivethirtyeight.com/polls/president-general/2024/florida/North Carolina: Trump +1/+2/+4
https://projects.fivethirtyeight.com/polls/president-general/2024/florida/Virginia: Harris +3
https://projects.fivethirtyeight.com/polls/president-general/2024/virginia/Pennsylvania: Toss Up, 2 tied polls, Trump +1/+4/+5
Michigan: Harris +2, tie
https://projects.fivethirtyeight.com/polls/president-general/2024/michigan/Wisconsin: Harris +4/+5, Trump +1
https://projects.fivethirtyeight.com/polls/president-general/2024/wisconsin/Minnesota: Harris +5/+7/+10
https://projects.fivethirtyeight.com/polls/president-general/2024/minnesota/So… changes from last time…
Nevada moves from Harris to toss up. Georgia has moved more to Harris. Michigan is still Harris but getting closer.
Plotted on the map, Harris only needs 1 of the three toss up states to win. Trump needs ALL THREE to hit 271.

Love your comments. Keep them up
Also if there’s a place to follow you, especially closer to the election let me know
I recently joined mastodon and follow almost no one there, so if you are there with these analysis definitely let me know
I’m a mod here so I post this stuff all the time. :)
Generally if you see a post reading “National poll says…” I’ll have a comment in it.
I also do the Trump Indictment checklist.
There will be a giant megathread for election day.
For contrast, Nate Silver’s model now has Harris less likely to win the EC:
“Harris is ahead by 3.8 points in our national poll tracker — up from 2.3 points the day before the Democratic Convention began — which does suggest some sort of convention bounce. However, she’s fallen to a 47.3 percent chance of winning the Electoral College versus 52.4 percent for Donald Trump. (The numbers don’t add to 100 because of the possibility of an Electoral College deadlock.)”
Let’s hope for a full Orange Turd flush.
You can’t flush a turd that landed on the seat, he is going to run every single election until he dies.
Honestly, I love that for the Republican party. Perpetually nominating the same dildo over and over, despite losing the election by a wider margin each time.
In 4 years I’m not sure he’ll be able to put together a sentence, let alone run for office again. His cognitive decline is accelerating with more slurring (both kinds), and just freezing mid-word and pivoting to some other thought because he can’t say or finish the word he wanted.
It will be interesting if the debate will have better mics than his iPhone to get his “perfect audio” that doesn’t make him sound like he forgot to put his teeth in like his “interview” with Musk. =)
He can hardly put together a sentence now…
if doesn’t, we know now not to use the sink plunger
Toilet plunger gang rise up
Waffle stomp him
He’s a big’un. Better get the poop knife.
It’s still all comes down to a coin flip in Pennsylvania
God help us
It’s so nice to see Kamala Harris popularity rising, but is it just me? Or can everybody else not see Trump popularity on 538?
Trump: https://projects.fivethirtyeight.com/polls/approval/donald-trump/
No graph nada ???% vs ???%
Latest numbers in the table below are from January!!!???
I find it hard to believe these numbers are not available from anywhere since January.Harris: https://projects.fivethirtyeight.com/polls/approval/kamala-harris/
Graph up to date ending Aug. 28 - 48.4% dis vs 42.5% Approve
Latest numbers in the table are all from August.Biden: https://projects.fivethirtyeight.com/polls/approval/joe-biden/
Graph up to date ending Aug. 28 - 54.2% dis vs 39.9% Approve
Latest numbers in table are all from August.I tried a different browser and I tried for a couple of days. The graph for Trump never shows?
Seems a bit suspect IMO, are they obscuring bad Trump numbers?Edit:
They do have a somewhat similar “favorability” number that’s comparable:
https://projects.fivethirtyeight.com/polls/favorability/donald-trump/
Trump is disfavored by almost 10% !!!I think they only look at approval ratings when someone is in office. In face those old approval rating polls for Trump probably are actually from January 2021.
For this election cycle you want to look at the favorability ratings for the two candidates instead.
https://projects.fivethirtyeight.com/polls/favorability/donald-trump/
Ah OK that explains it.
Thank You. 👍Still they do have a similar number that’s comparable, it’s just called favorability instead of approval? https://projects.fivethirtyeight.com/polls/favorability/donald-trump/
Funny how many disapproved of Trump, but now favor him anyway?
It’s a different question. Something like “How do you approve of Donald Trump’s job as president?” instead of “How favorably do you view Donald Trump?” Exactly what question you ask, and how you ask it, can make a big difference on how people answer.
Yes, good point.
“Approval” means “job approval”. It only applies to incumbents, because it asks “Is X doing a good job in office?”. Your last chance to disapprove of Trump was January 2021.
“Favorability” applies to everyone, it asks “Do you like X?”
deleted by creator
USA Today - News Source Context (Click to view Full Report)
Information for USA Today:
MBFC: Left-Center - Credibility: High - Factual Reporting: Mostly Factual - United States of America
Wikipedia about this sourceSearch topics on Ground.News


